About Your Overview Page
Learn more about your overview page and how easy it is to navigate through your account.
In this article we'll cover:
- Locating your overview page
- Viewing your connected integrations
- Viewing your stock status
- Viewing your orders module
- Viewing your manufactures module
- Viewing your purchases summary
- Viewing your business cashflow module
- Viewing your recent activity
- Overview page FAQ
Your Overview Page in the app provides a snapshot of your business's current performance and recent activity, designed to help you monitor essential metrics and identify trends at a glance. This dashboard includes key insights such as total sales, expenses, inventory values, and recent orders. It features sections with graphs and summaries to track your revenue, profit, and expense trends over time, offering a quick view of your financial health.
The dashboard
On the left panel of your Overview Page, you will find the the dashboard, which offers quick access to your Manufactures, Orders, Purchases, Products, Materials, Components, and Reports.

Integrations
The integrations section on the left panel displays a list of all the sales channels and platforms connected to your account and gives you quick access to the settings of your integrations. This includes integrations with sales platforms like Shopify, Etsy, Amazon, etc.

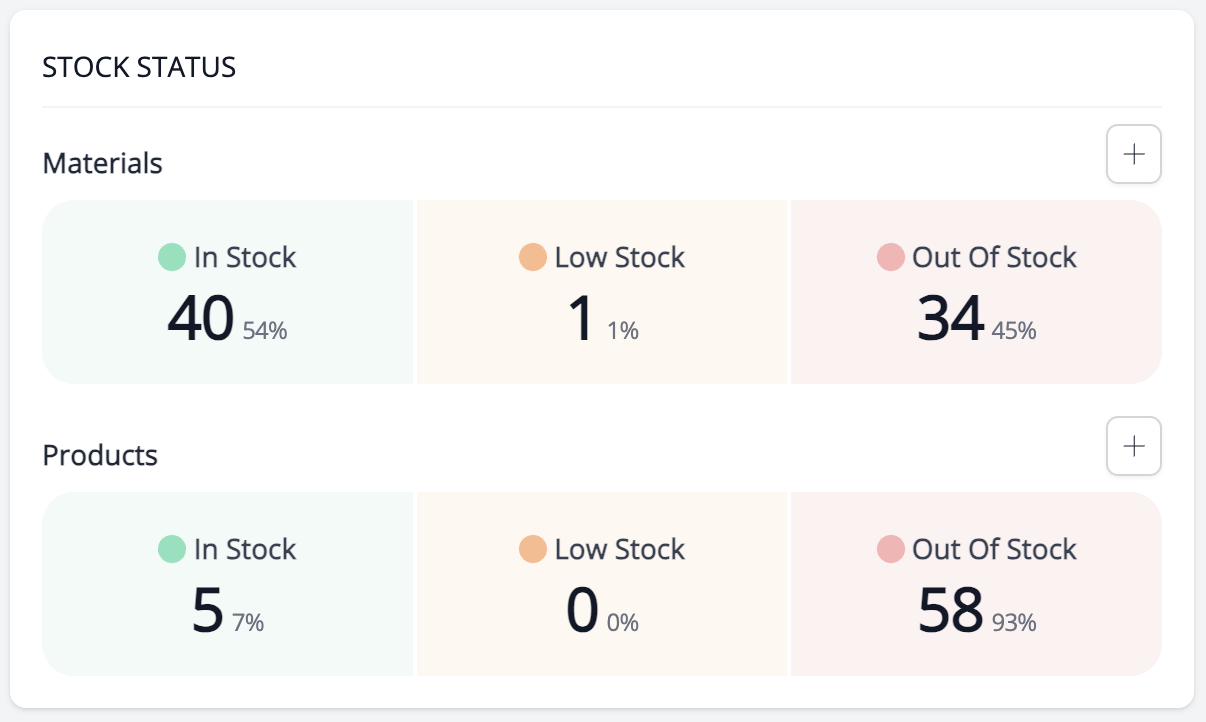
Stock Status
This section gives you a quick overview of your inventory levels, so you can see exactly what’s in stock, low on stock, or out of stock at a glance. Items in stock are highlighted in green, low-stock items appear in yellow, and anything out of stock is marked in red. This simple colour-coding makes it easy to spot what might need restocking.
If you’d like to take a closer look, just click on any of the status bars!
You’ll be taken directly to your materials or products page, with filters already set to show the items in that status. This way, you can quickly manage your inventory without any extra steps.
Orders
The orders section of your overview page gives you a clear summary of your total orders, complete with a graph that shows your order activity over the selected timeframe. This visual helps you easily track trends and understand your sales performance.

Please note: The graph includes the total amount collected before taxes, giving you a full view of revenue trends. Above the graph, you’ll see the order revenue values, which represent the total collected before taxes, so you have a clear picture of net sales.
About Calculations: Counts all orders that have been manufactured during the timeframe, excluding cancelled orders.
Overview Metrics
-
Placed Orders:
Displays the total number of orders created within the selected time period. Next to the tally, you’ll see a comparison indicator showing the difference in orders placed compared to the previous time period.
-
Made Orders:
Represents all orders with a manufacture date within the selected time period. This is a calculation that includes a comparison indicator showing the whole number difference from the previous time period.
-
Shipped Orders:
Displays the total number of orders shipped during the selected time period. This calculation also includes a comparison indicator showing the difference from the previous time period.
-
Revenue:
Displays the grand total sum of all orders for the selected time period. The comparison indicator here shows the percentage difference in revenue compared to the previous time period.
-
Material Cost:
Reflects the total material cost for all orders within the selected time period. The percentage difference from the previous time period is shown as a comparison.
-
Items Ordered:
Displays the sum of quantities of all items ordered within the selected time period. This is a calculation and includes a whole-number comparison with the previous time period.
Example: If "This Week" is selected, the comparison will show the difference between orders from this week and last week.
Manufactures
The manufactures section displays a graph representing your manufacturing activity over the selected timeframe. The graph highlights two key components:
- Total Material Cost: Highlighted in yellow, this shows the cumulative cost of materials used in manufacturing.
- Total Internal Labour: Highlighted in green, this represents the total cost of internal labour associated with manufacturing.
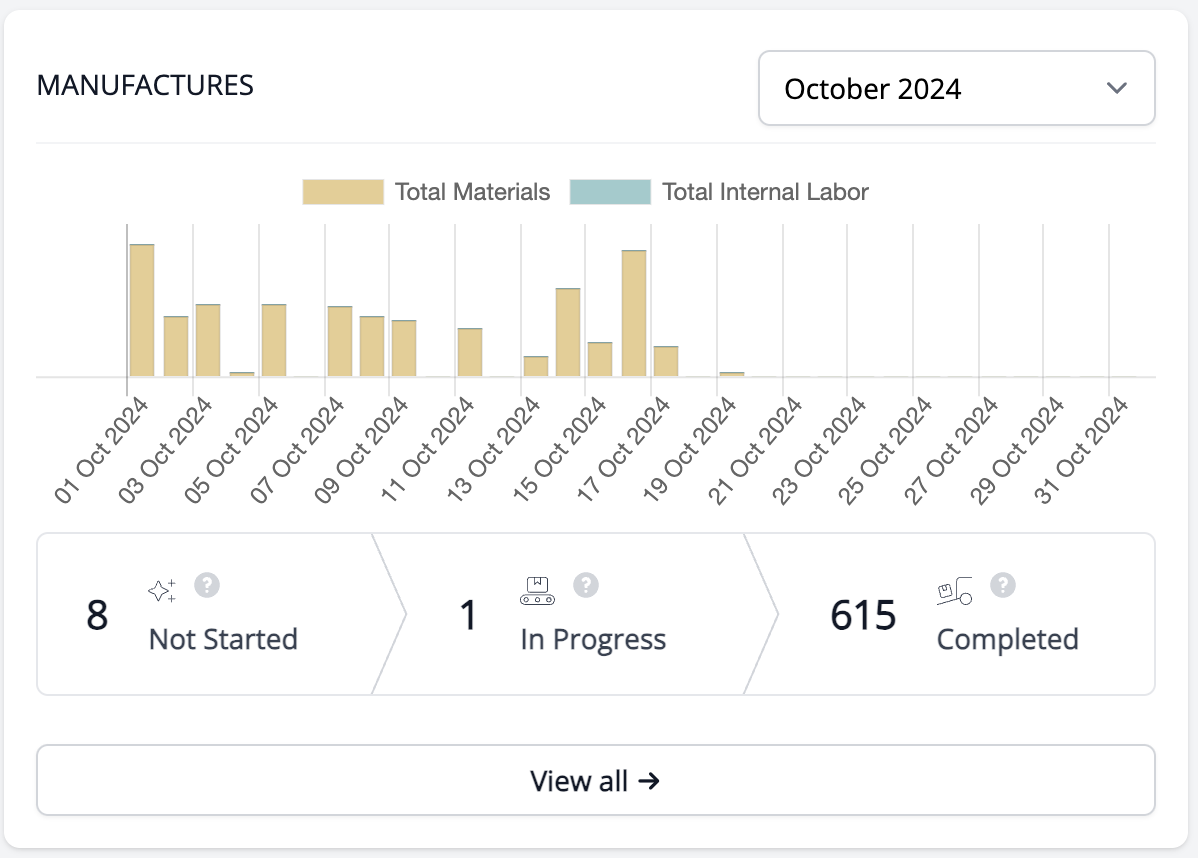
At the bottom of the graph, you’ll find a visual representation of the current stages of your production process, designed to help you track manufacturing progress with greater ease. Each stage represents a key milestone in your production workflow, such as Planned, In Progress, or Completed. This breakdown provides a clear overview of where your products are in the production pipeline, making it easier to identify bottlenecks and manage timelines. You can learn more about manufacture production statuses here.
Purchases
The purchases section on your Overview page gives you a clear and detailed breakdown of your total purchases. It features a colour-coded pie chart that shows your spending by category, making it easy to understand where your money is going. When you hover over any section of the pie chart, you’ll see the percentage of spending for that category, helping you analyse your purchasing habits at a glance.
While the timeframe options are fixed, you can select from preset periods to compare your spending. The total purchases are calculated and displayed alongside a comparison to the previous period, giving you valuable insights into how your spending trends over time.

You’ll see the Total Purchases, which shows the total value of purchases made during the selected time period, along with a percentage comparison to the previous period (e.g., This Week vs. Last Week). Additionally, the Purchases on Order metric gives you a count of all purchase line items marked as "Not Received," providing an easy way to track outstanding orders.
Cashflow
The Cashflow section provides a clear visual representation of your financial activity over a selected timeframe. This graph highlights your orders in blue and your purchases in red. The values are plotted based on the selected timeframe filter, allowing you to easily compare your sales against your expenses over any given period. This section gives you a comprehensive view of your business’s financial health, helping you make informed decisions based on your sales and expenditure trends.

Latest Activity
On your right-side panel, you will see the recent activity section, which will provide you with a log of your most recent actions and updates within the app. This includes activities such as new orders, inventory adjustments, and product updates. It helps you stay informed about your account’s latest changes and activities.

Overview page FAQ
Can I change my default filter dates?
No, the filter dates on your Overview page are fixed and cannot be customised. You can, however, select from preset timeframes to analyse your data.
How often is the data on your Overview page updated?
The data on your Overview page is updated in real-time as you make changes within your account. This ensures that the information displayed is always current and accurate.
Can I customise the sections displayed on your Overview page?
The sections on your Overview page are fixed and designed to provide a comprehensive snapshot of your business. While you can’t add or remove sections, you can focus on specific details like orders, purchases, or inventory by going to those sections.
Need help?
- If you have any questions about your account and how to get started, take a look at the Getting Started section.
- Are you encountering any issues with your account? Reach out to us at help@craftybase.com or via our contact page.